
How to Prioritize
To work smarter (not harder), you need to know how to size and prioritize

I once sat on a committee to decide on manager promotions. When debating between two candidates (let’s call them A and B), the managers’ unanimous opinion was that while A and B were both excellent at leading projects to the finish line, A would be a better team leader because she could “better judge the ROI of all work streams and help herself and the team prioritize".
Being able to prioritize is undoubtedly one of the most important soft skills for managers and ICs alike. Working in a fast-paced company means you never just have one task on hand; even the most junior member on my team has multiple things they are working on at any given time. At the same time, there’s always pressure to deliver quickly since leadership and stakeholders want everything yesterday.
So knowing how to stack rank all the things on your plate in terms of priority is extremely important at all levels of the team. And if you want to grow into a more senior role or become a manager, it becomes absolutely essential.
However, based on my experience leading data science teams, this skill is not part of any formal training and it takes most people a long time to learn it through trial and error. I regularly see people working hard and delivering high-quality outputs and still get the feedback from cross-functional stakeholders that they are not doing things “fast enough” or “driving enough impact”.
When I sit down with them to look through their backlog of things, it’s clear that they have been prioritizing the wrong things.
You might think "Prioritization is easy, shouldn’t I just work on the things my manager/stakeholders asked me to work on?”. While that should definitely be part of your consideration, you will soon realize that most stakeholders have a pretty low bar for “asking for analysis” and your manager will not be able to stay on top of everything on everyone’s plate on the team. So it’s eventually part of your job to decide whether something should be prioritized.

The key to this is to understand which initiative drives the most impact. And “impact” is different from “output” or “input”:
I noticed that the most junior DS on the team talk about “inputs” – “I spent X hours working on these analyses”
More senior DS learn to uplevel from “inputs” to “outputs”; they’ll say “I helped with 5 experiments and built two dashboards”
But only a handful are able to clearly articulate the business impact they drove; they’ll focus on the money they helped the company save, or the growth in important metrics they helped drive
Even though it’s rarely an explicitly stated skill requirement, knowing how to prioritize is nevertheless a “hidden” requirement for anyone’s career progress because it’s a pre-requisite for driving impact. Working hard and delivering high-quality work is important, but it only matters if it's on the right projects.
In this article, I will convince you why being able to judge priorities is crucial across all roles (DS, PM, engineering, etc.), break down the mental prioritization framework you can immediately put to use, and walk you through a hands-on example of how to apply it.
To achieve any goal, prioritization is key; and to prioritize, you need to know the ROI
If somebody gave your team a big goal (say, growing the monthly active member base from 10M to 50M), would you know:
Whether it’s a realistic goal you can hit?
How can you hit the goal, i.e. what do you need to do exactly?
If you answered “No”, you’re not alone; nobody can answer these questions off the bat. The reason is that businesses are complex; you’ll need many different initiatives to hit an ambitious goal like that, and you cannot assume that what worked in the past will get you to the next level as well.
In other words, you need to break this big, abstract goal into smaller, concrete work streams and then come up with ideas that will help you move the needle on your target metrics. And then, once you have a list of things you could do, you need to figure out which ones you should actually prioritize. You don’t have unlimited resources to do everything (especially not in a single quarter), so you need to select the initiatives with the biggest potential.
That’s where ROI estimation comes in. ROI stands for “return on investment”:
Investment: How much of your limited resources you put in (usually time or money)
Return: How much business impact you (expect to) get as a result
In other words, you’re looking for the biggest “bang for your buck”.
Estimations like this are essential during planning cycles to make sure teams are working on the most impactful things. Here is what that would look like in an ideal state:
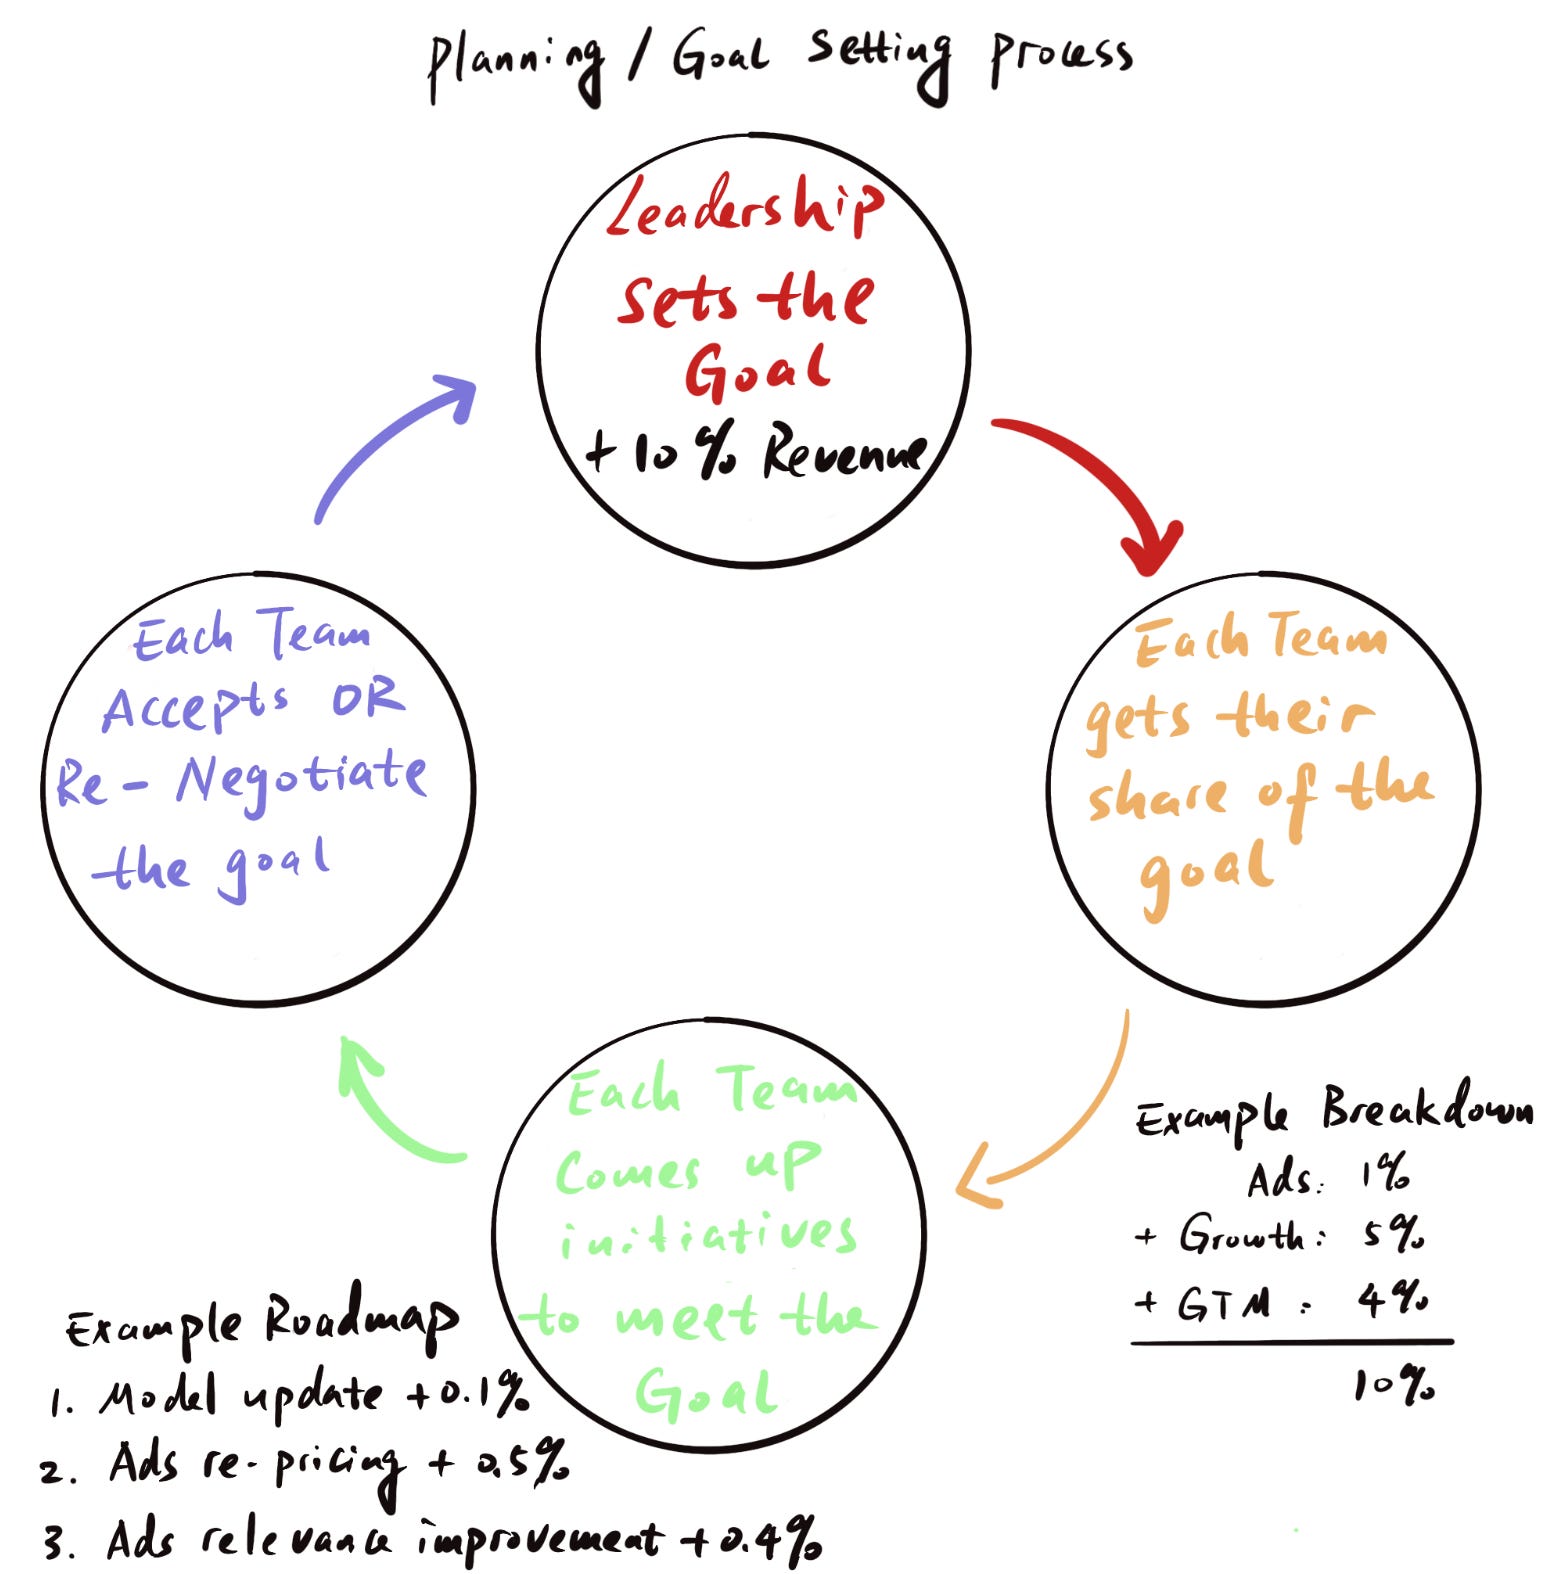
Leadership decides on top-down goals for the company (e.g. grow revenue by $XM)
The goal is distributed across the different organizations by assigning team-level goals (e.g. product team 1 needs to contribute 20% of the goal, product team 2 30% etc.)
Teams brainstorm initiatives that can help them hit their goal
Teams estimate the impact of each initiative they came up with and stack-rank them; the most promising ones become the roadmap for the quarter, and the rest goes into the backlog
[Optional] Based on steps 1 - 4 above, teams should have an idea of whether they’ll be able to hit their goal if they successfully executive their roadmap. If they won’t, they either need to come up with more (or better) initiatives, or push back on the goal they’ve been given
Besides helping teams prioritize, the impact estimates also give you goals for each initiative that you can track against throughout the quarter. Then, after the quarter is over, you can do a retrospective and compare actuals against the plan. If any initiatives missed their goal due to overly optimistic or pessimistic estimates rather than execution issues, you can use those insights to refine your estimates during future planning exercises.
Unfortunately, this process doesn’t always get the attention it deserves. Some companies and teams run very structured planning processes and loop in the data science team (or business operations) early to help with these calculations, but other teams rely on experience to come up with these numbers, or simply “make an educated guess” when they run out of time.

If you notice a gap like this, it’s a great opportunity for you to step up and offer to help your stakeholders to level up the process. And don’t worry if you don’t have experience in this regard: This guide will give you the toolkit you need to do that.
In addition to planning, impact estimation is also helpful day-to-day when you are trying to decide 1) whether you should take on a new project or 2) which project on your plate you should focus on. This is important not just for managers that are trying to figure this out for their teams; even as an IC you should constantly make sure you’re working on high-impact things.
Like it or not, when it comes to promotions, the most important thing is whether you helped drive business impact. It doesn’t matter how hard you work, if the project goes nowhere or doesn’t move the needle, it’s not going to be helpful for your promo packet.
That’s not to say that you need to do an elaborate estimation for every single project you work on; once you’re familiar with the technique and have practiced it a bit, you’ll start doing it subconsciously and will quickly develop a gut feeling about a project’s potential. However, learning the “proper” way of calculating ROI can help you build the foundation for this mental model and refine it.
While the “I” can be estimated from experience, the “R” needs to be deduced based on first principles
So how to estimate ROI? There are two components in ROI, Return and Investment.
I won’t spend too much time on the investment piece in this article because it’s less generalizable. If a project is similar to work you’ve done in the past, you will likely have a pretty good idea of how much effort it’ll be. And if it’s something new, your estimate will likely be very off anyways, so don’t spend too much time on it. According to Hofstadter’s Law, things always take longer than expected, so whatever your initial estimated effort is, double it and call it a day.
The piece that is much more important to get right — but that a lot of people struggle to estimate — is the “return” component. Luckily, this is the part that you can actually estimate somewhat accurately by taking a first-principles approach, and the framework is generalizable for different domains.
Step 1. Define the “return”
When estimating the impact, you first need to decide which metric you want to anchor the impact on. For example, for a planned feature that is supposed to drive user engagement, should you estimate the % increase of total time spent on site or the amount of additional revenue?
This is important because it facilitates a “common currency” and enables an apples-to-apples comparison. Without anchoring to key metrics, you might have one initiative sized to drive “15% incremental time spent on site” and another sized to “increase revenue by 5%”. How do you know which one is more impactful?
Besides making sure you’re using the same impact metric for all estimates, it’s also important that you’re choosing one that teams think and care about (e.g. because they’ve set goals against it); otherwise, it’s hard to convey the impact because you won’t get their attention.
Which metric you ultimately choose depends highly on what your company cares about. In most companies, there are a handful of metrics that everyone rallies around, be it a north star metric or a set of topline KPIs around growth and revenue or profitability. In addition, each org may have a couple of key metrics it’s responsible for driving, and staying close to the planning process will help you understand what those are.
To have a tangible example for the rest of this post, let’s say your company ultimately wants to know the impact of any initiative in terms of revenue.
Step 2. Have clarity about which lever you are moving
Once you decide what impact metric you are doing the sizing on, the problem becomes much clearer. You’re basically asking:
“How much can I lift X (your “return” or impact metric) by improving Y (the lever that can be improved by the initiative you have in mind) by Z%?”
You already know your X (the ultimate business impact you’re sizing; in our example, that’s revenue) from the previous section, so the next step is to figure out Y (the immediate improvement your initiative can drive). This means you have to translate the qualitative thing you plan to do to the immediate quantitative impact you expect.
To continue our example, let’s say you are a DS working with the feed product team at a social media company. And one of the initiatives the team has in mind is to improve the feed ranking algorithm so that users see more relevant content and ultimately scroll more and consume more content units.
In this case, our Y (the quantitative impact from our initiative) would be “# content consumed / visitor” .
Then it comes to the difficult part: Translating this improvement into the ultimate business impact (i.e. revenue increase) you care about. This requires establishing a lineage between the metrics, and the best way to do that is through building a driver tree.
Which brings us to the next essential step.
Step 3. Understand other levers that affect your target metric
Building out the driver tree has two key advantages:
Establishing a lineage between your initiative impact Y and your target metric X (as mentioned above)
Providing a comprehensive list of levers for X
At this point you might ask, why is the second piece important if I already know which lever I want to move?
The reason is that there are typically a lot of ways (levers) to move your target metric, and any given initiative will only affect a subset of them. It’s essential to have visibility into all the other moving pieces, because by asking “How much can this initiative improve X?”, we are really asking “How much can this improve X, holding everything else equal?”.
Much like when running a regression, you need to control for confounding factors to establish the relationship between X and Y.
I have covered driver trees extensively in my previous articles, so I will not repeat everything here, but the general idea is to break down the target metric into drivers that are MECE (Mutually Exclusive and Collectively Exhaustive). What this means is best explained by applying this principle to our example.
As a recap, your ultimate goal is to increase revenue. The company likely has more than one revenue stream; but as a social media company, any improvement on feed will likely mostly impact the revenue stream coming from ads. This means we can focus on ads revenue as the top of the driver tree.
Let’s also assume ads revenue is click-based (i.e. advertisers are charged, and you make money, per click). We can then decompose this mathematically:
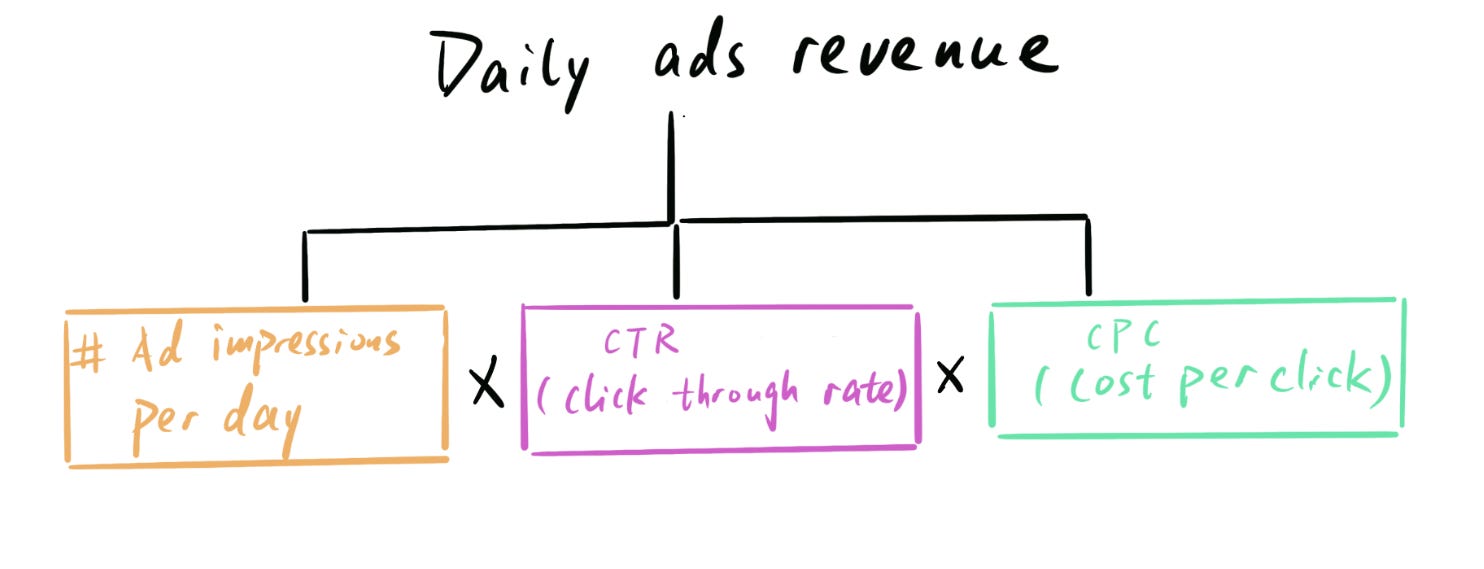
This breakdown is MECE because 1) Any change in ad revenue is explained by a change in one of these three drivers (i.e. “collectively exhaustive”), and 2) every driver represents a distinct component with no overlap (i.e. “mutually exclusive”): Volume, conversion and price.
Then, “# ad impressions” can be further broken down:
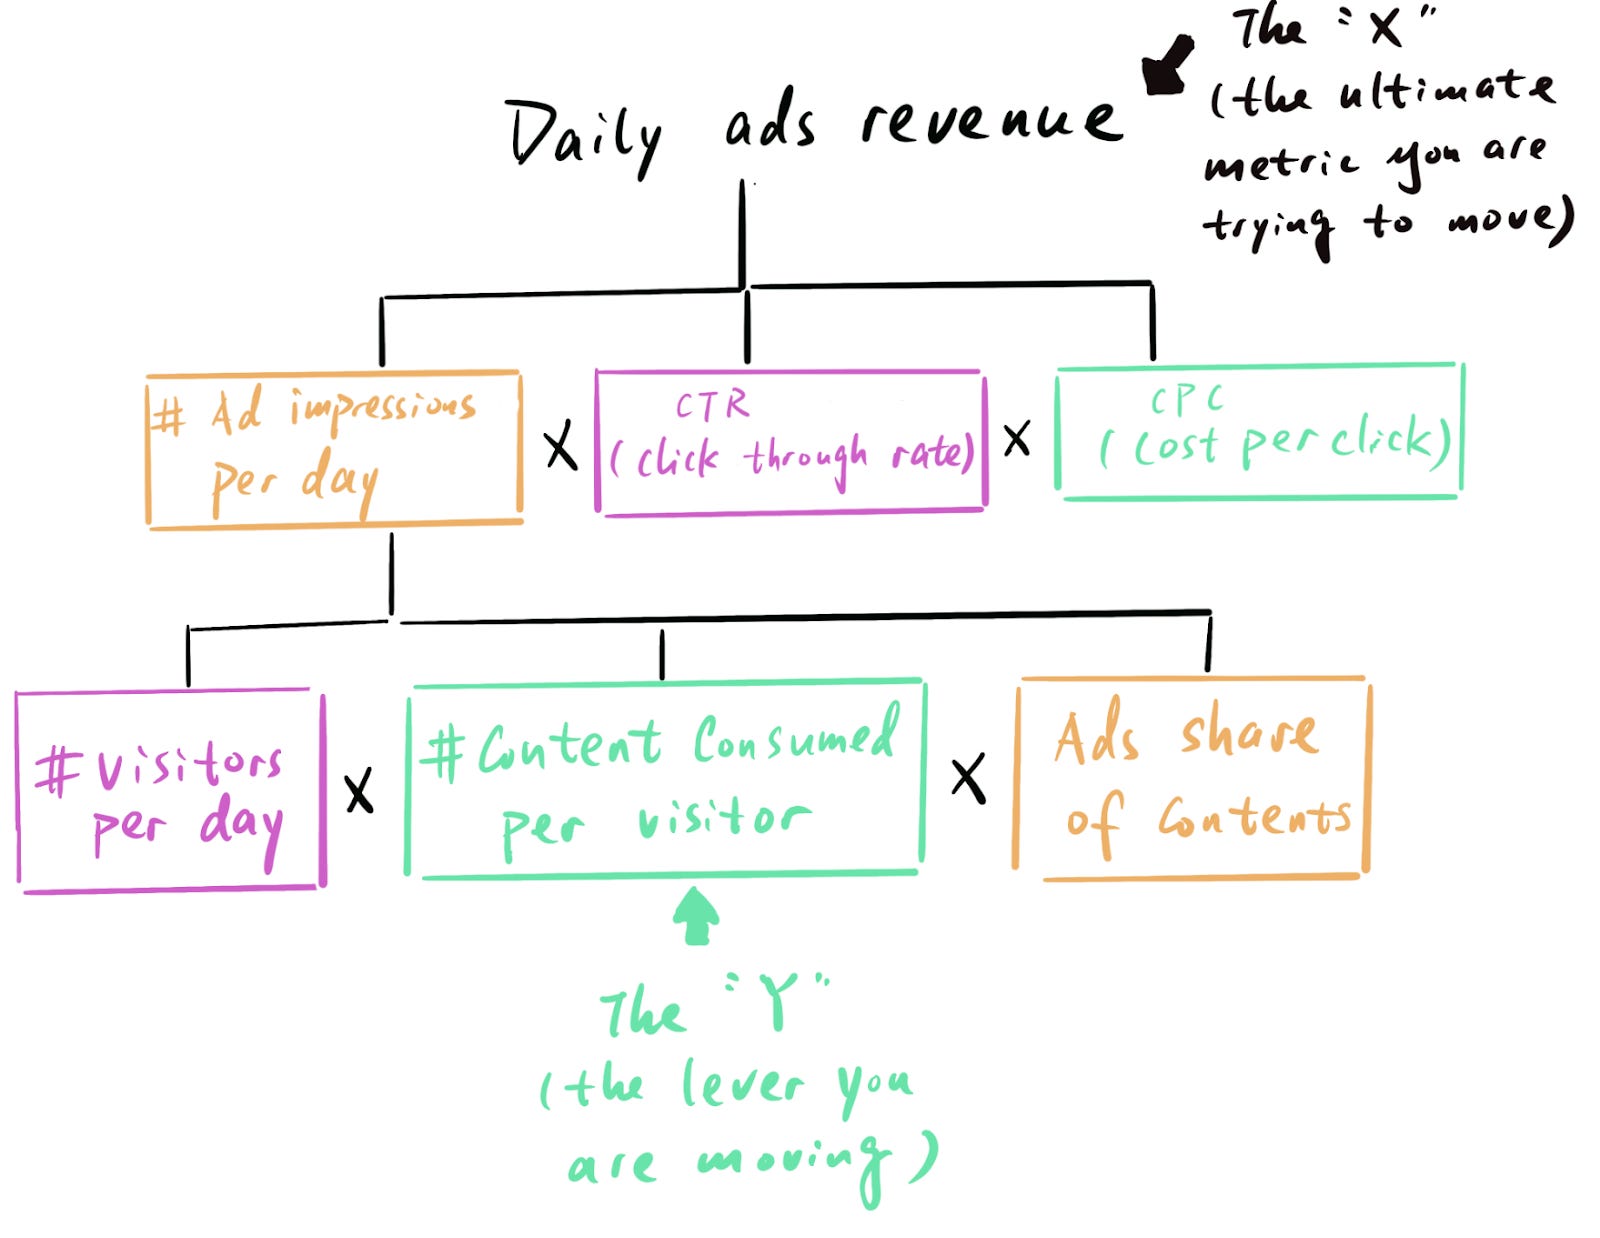
You need to keep on building out the tree (by breaking down the components into more granular subcomponents like shown above) until the metric you plan to move through your initiative (Y) shows up as a branch in the tree; then you can figure out the quantitative relationship by tracing the path all the way up to your target metric X.
And all the other branches on the tree are the additional levers you need to control for in your sizing.
Step 4. Use the lineage to build the sizing and make implicit assumptions explicit
The previous steps were about understanding the relationships between what you can control and the impact metric you are ultimately trying to size. Now, it’s time to start creating the actual structure of your sizing calculation.
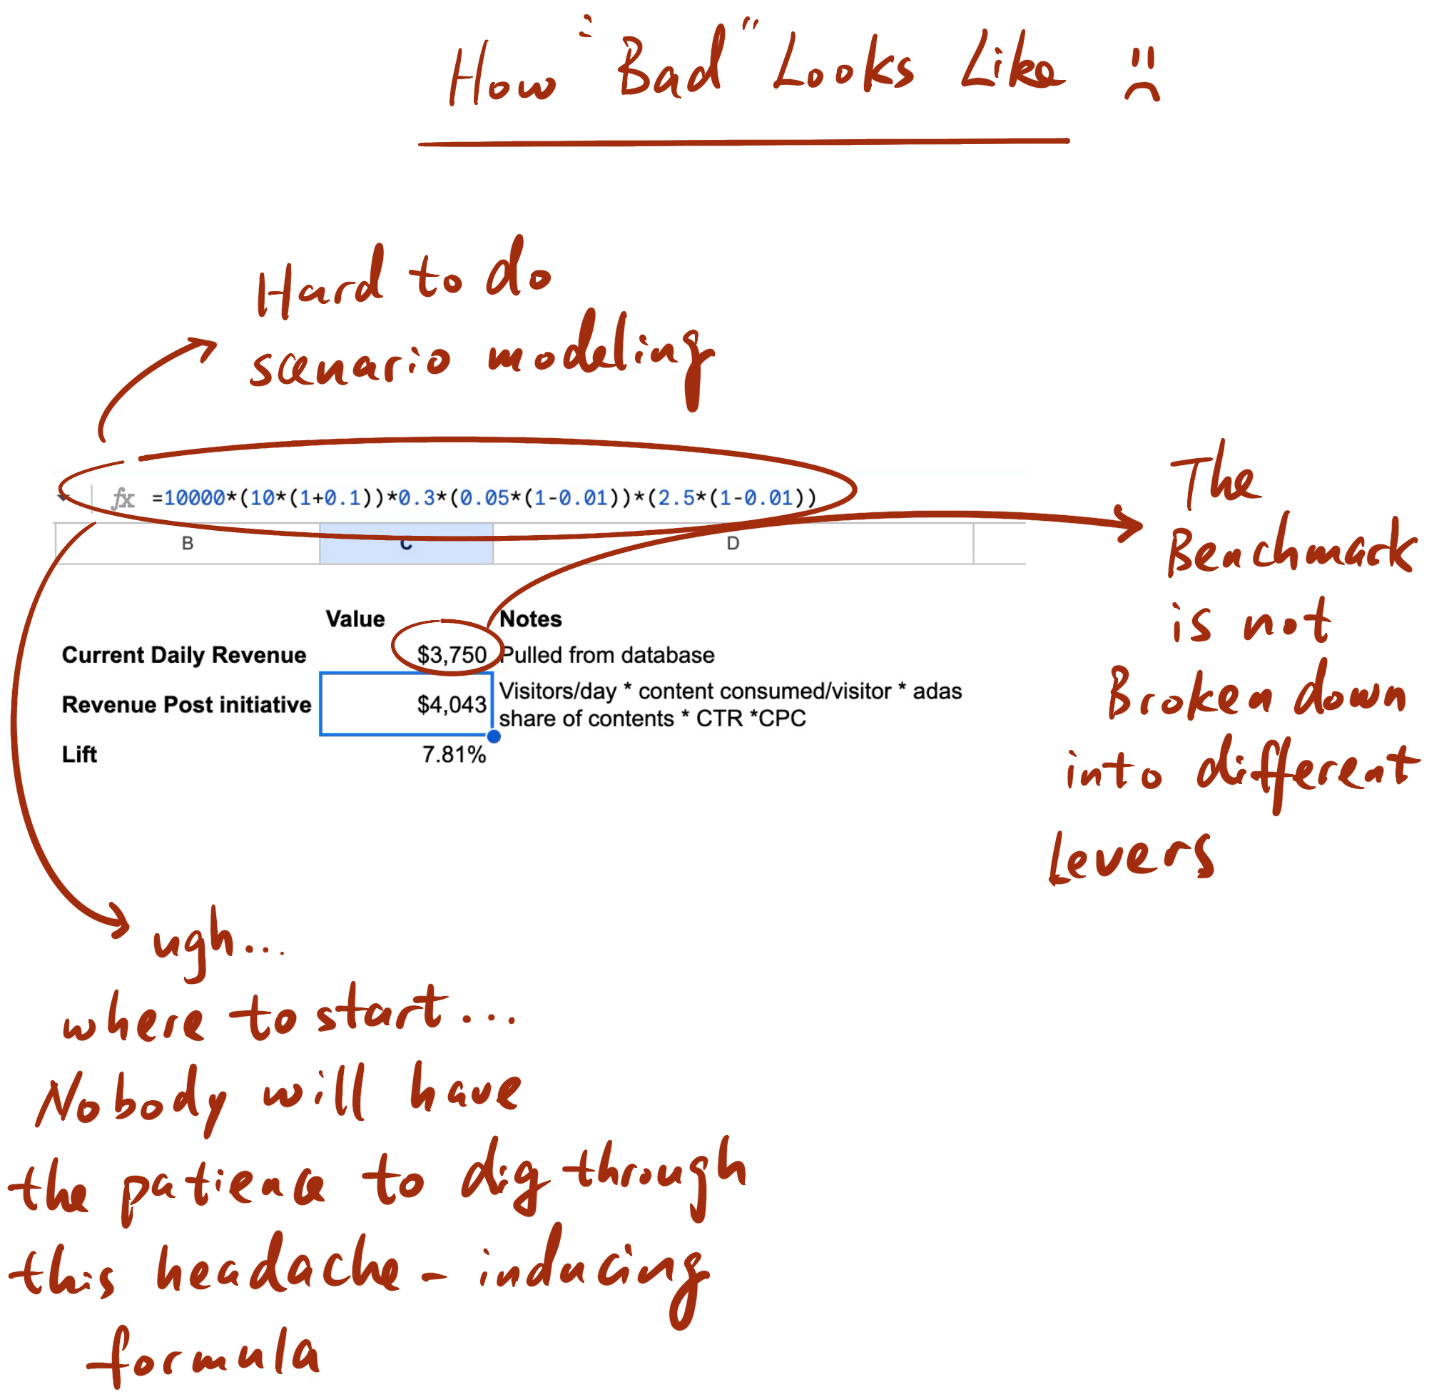
This step should be pretty easy once you’ve done all of the prep work in the previous steps; you have all the pieces and you just need to put them together. The only tricky part here is thinking through how to set this up in a spreadsheet. Ideally you want to make this sizing not only a hacky one-off effort that lands in the trash after, but rather something that can be leveraged in the future for similar initiatives that aim to drive the same impact metric.
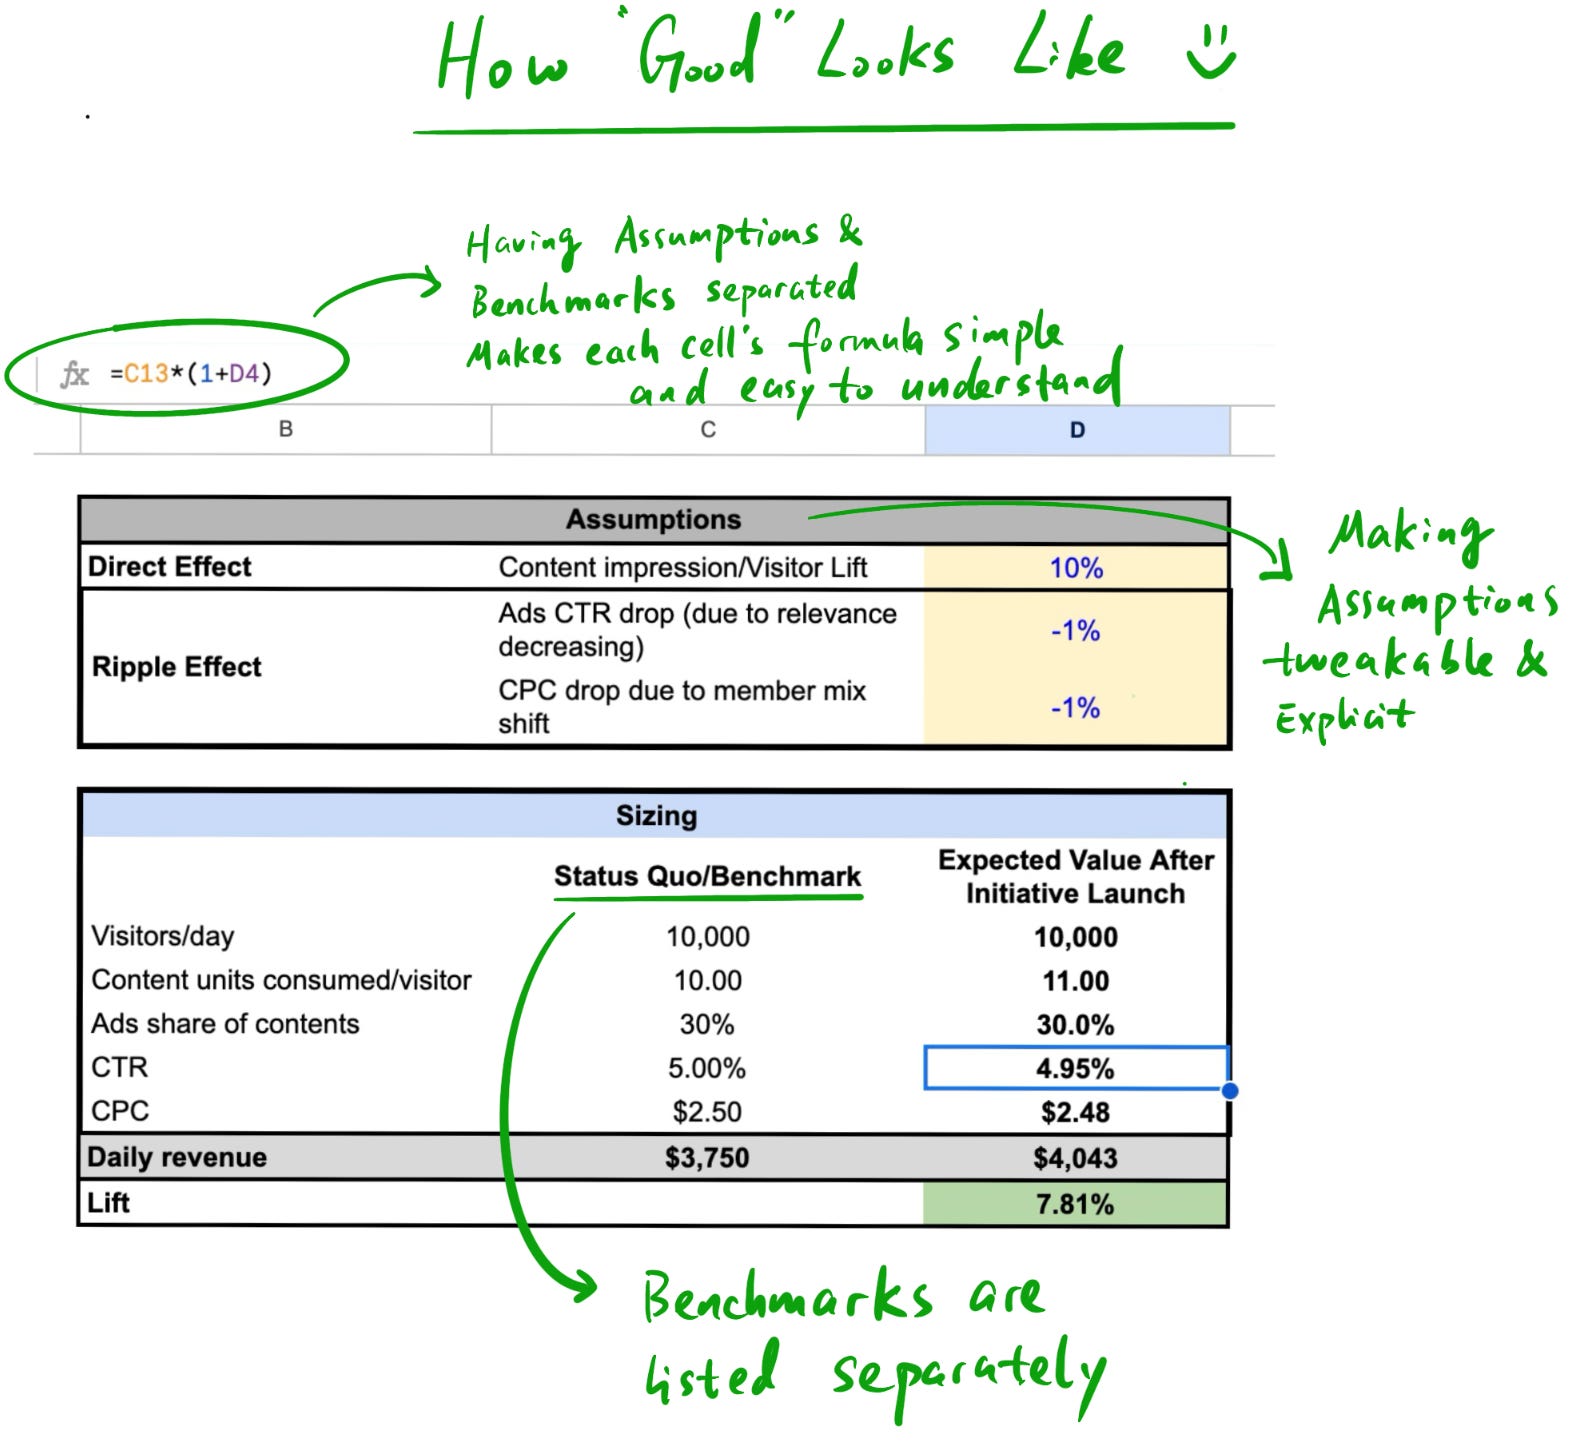
One tip for enabling this scalability is to separate the structure of the calculation from the assumptions. In other words, list out the relevant variables from your driver tree and link them, and then have a separate section where you list out all of your assumptions like the expected lift from your initiative (instead of hardcoding them into the formulas).
This has a few key advantages besides making the sizing re-usable:
Transparency: It’s easy for others to see in one spot what assumptions you’re making. If anyone questions the end result, you can quickly figure out which exact assumption they disagree with
Scenario modeling: You can easily tweak each assumption to see how the outcome changes. For example, you could figure out what the upper and lower bounds of possible impact are by plugging in the most ambitious or conservative assumptions for each driver
Diagnosing underperformance: If the initiative gets launched and performance is not meeting the projected impact, it’s easier to root cause why you’re missing the target, i.e. which specific assumption was off. This then allows you to refine your projections in the future
Step 5. Plug numbers into your sizing
Now that you have all the levers listed out, how do you know what values to plug in?
To start, you need baseline numbers for all of your metrics; this can be something like the average value over the last three months, and you can usually pull it from a dashboard or directly from a table in the data warehouse.
Then, you need to apply the anticipated % improvement to the lever you plan to move (the “Z” from our equation under Step 2). I.e. in our example, we need to plug in the % increase in feed content consumption per user that we expect from our ranking change.
You can estimate this anticipated lift by benchmarking against similar past initiatives. It’s likely not the first time the team has made improvements to the ranker to improve relevance, so you can reference those experiments or launches to get a rough idea of what to expect this time.
You’ll often find that there are trends you can forecast out; for example, you might find that the team has tackled all of the low-hanging fruit already, and the most recent improvements were mostly smaller fine-tuning changes with diminishing returns. Taking these trends into account will get you a more accurate range for where the impact of your upcoming initiative might land.
Step 6. Consider and model out any ripple effect of this change
Until this step, we have been working off of one big assumption: our initiative will move certain levers and the rest of them will be constant. This is essentially assuming that there’s no interaction effect between different levers. In reality though, when one lever is moved, there’s almost always ripple effects on other ones, and it’s important to anticipate these.
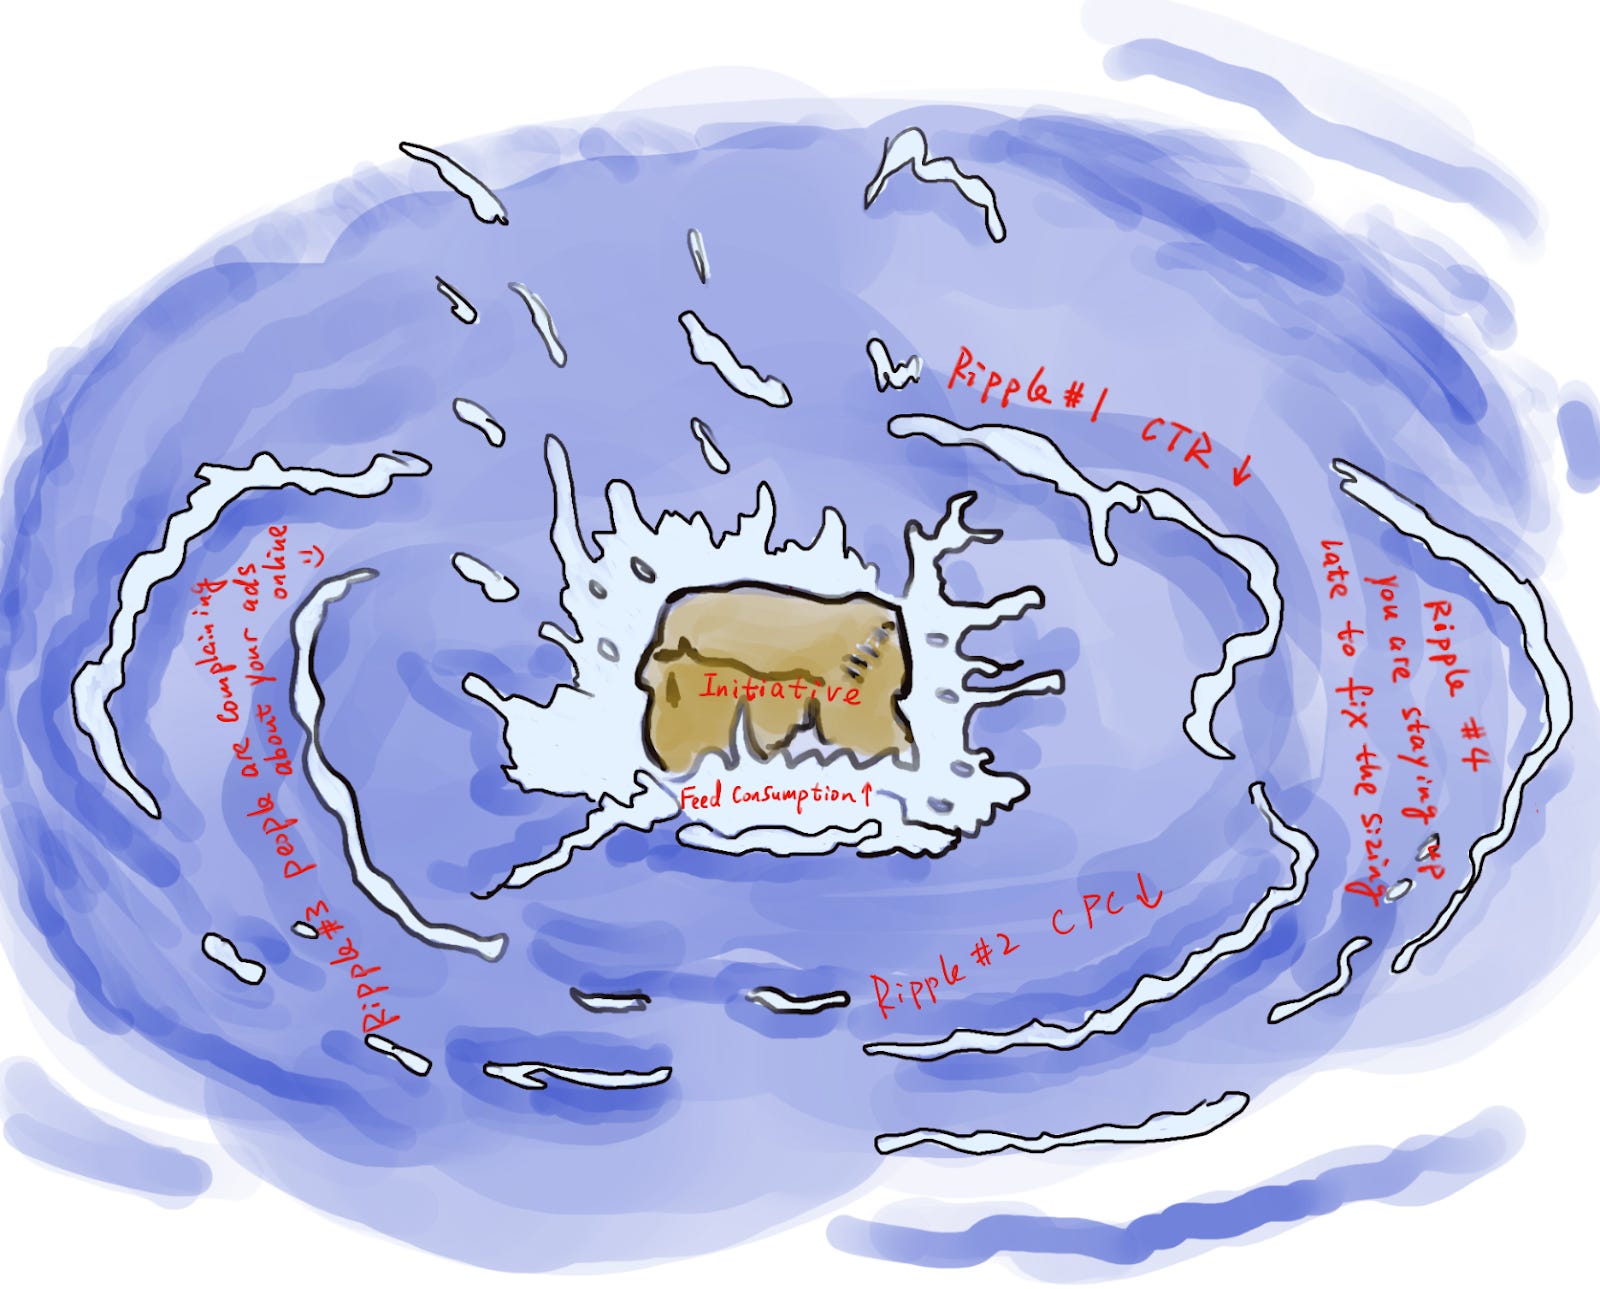
For the sizing to be as accurate as possible, it’s crucial to model out the major interactions. In our example, when we increase relevance of feed content, members will consume more content when they are on site. And in turn they will consume more ads (assuming the ads share of contents is kept the same).
It would be naive to assume, however, that members will keep the same level of click-through-rate on ads when they are shown more of them.
In addition, if the ranking change is expected to affect some user groups more than others (e.g. because it’s leveraging a signal that is more relevant for certain users), those users will start accounting for a larger share of content and ad impressions, and your average cost per click might change as a result (since not all users are equally valuable to advertisers).
Again, past experiments will be the best data source to estimate this impact. Once you have enough data, you can start developing simple rules of thumb such as “A 1% increase in the number of ads shown per session results in a X% decrease in CTR”. This will make it easier to do these sizing exercises in the future since you won’t have to look at raw experiment data every time.
Lastly, these ripple effects should be part of the “Assumptions” section of the sizing spreadsheet so it’s easy to tweak them and model out different scenarios when needed.
Remember, sizing is an art as much as it’s a science.
Of course you can always make the sizing more accurate; but at the end of the day, it’s important to remember that nobody has a crystal ball that predicts the future. The sizing is just an attempt to estimate the order of magnitude of what you expect to happen, so you need to be comfortable with “good enoughs” in this process.
Remember, while “good enough” is not perfect, it’s better than flying blind and having no estimation at all.
Making all the assumptions explicit and tweak-able is enabling us to iterate on the sizing when we have learnings in the process (e.g. in the online experiment, we might notice that we have under-estimated some ripple effect) so our modeling can get closer to reality as we iterate on it with new information.
Motivational Interviewing is a great tool for uncovering the potential ROI of actions or requests.