This Is How You Can Attract and Keep Data Talents
A data-driven answer based on StackOverflow surveys for how to compete for and retain the best talents in Data Science
A data-driven answer based on StackOverflow surveys for how to compete for and retain the best talents in Data Science

Most companies will tell you that the most valuable asset they have is people. In the era of big data and rapid digitization, companies start putting more and more of their efforts towards attracting and retaining the best data talents. From database administrators to data analysts, technical data positions sometimes can take up to 6 months to be (back)filled.
While a lot of companies attempt to understand churn through exit surveys and other means, few have the volume and quality of data necessary to truly identify patterns. Furthermore, in my view, it is much more effective to proactively invest in retention rather than reacting to concerning churn trends after they already materialized.
In order to develop a proactive retention and acquisition strategy for technical talent, managers should ask themselves two questions:
How can I increase satisfaction among my technical talents so they don’t churn?
How do I attract new talents when the current ones churn?
And what could be a better way to answer these questions than asking the technical talents themselves? StackOverflow did exactly that.
If you are not familiar with StackOverflow, it’s a platform where programmers (and professionals from related fields) ask and answer questions. StackOverflow carries out an annual survey asking their users about their jobs, their preference for different programming languages, etc. aiming to learn more about programmers’ attitudes toward different topics related to their profession. I’m going to use the survey answers from 2020 to answer the two questions we posed above. If you want to learn more about the survey, the survey results can be found here.
Chapter 1: How happy are your technical talents?
In order to focus my analysis and eliminate as many confounding factors as possible, I’m limiting the scope to only participants that live in the USA and have data related jobs (e.g. data scientist, data analyst, database administrator).
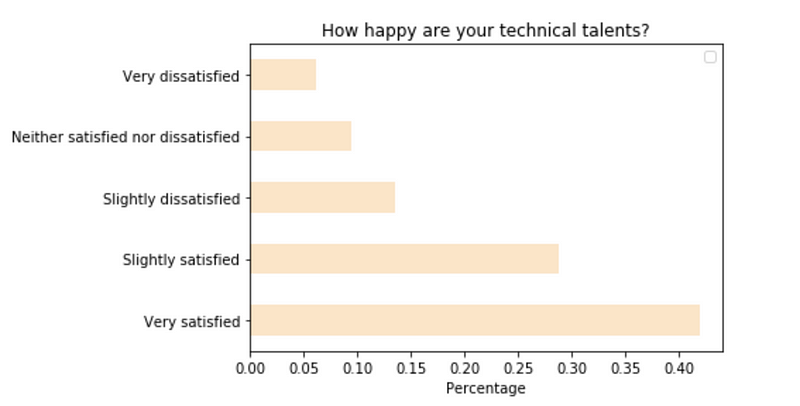
Out of 2,757 people who answered the survey, more than 40% are very satisfied with their current job, and around 30% are slightly satisfied. Seems like most companies are treating their data talents fairly well.
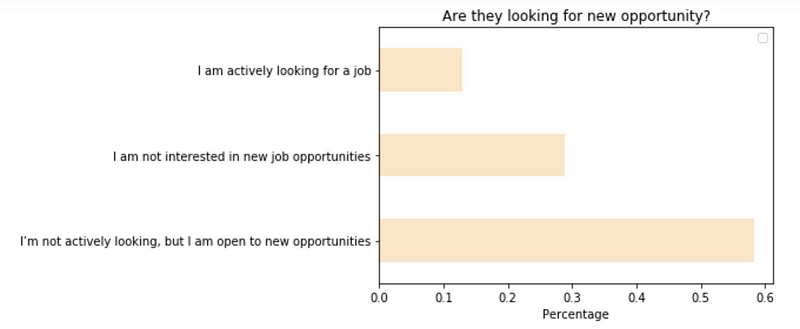
But does that mean they are not going to churn? Absolutely not. Less than 30% of respondents indicated that they are not interested in new opportunities. That means the rest (more than 70%) might leave when a recruiter/headhunter on LinkedIn puts an attractive opportunity on their radars.
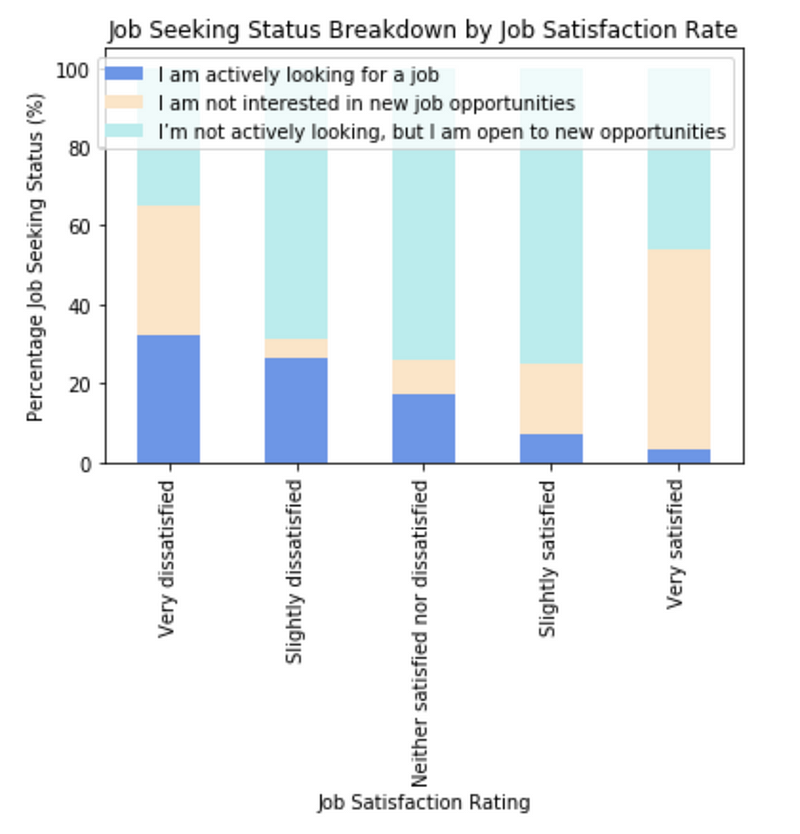
But before you give up hope and think the majority of your technical talents are going to turn their backs on you regardless of how well you are treating them, think again. When looking at participants’ “job seeking” status breakdown by job satisfaction (graph below), it’s obvious that the happier they are, the less likely your tech talents are to be open to or actively looking for new job opportunities (except the interesting group of people on the far left who are very dissatisfied with their jobs but are also not interested in new opportunities; maybe they have just accepted their fate). A large step change can be observed when employees are “very satisfied”; in this case, the chance that they will be “not interested in new opportunities” increases to more than 50%.
Not surprising at all, right? But what’s not intuitive is how to increase the satisfaction; so let’s find out from the survey.
Chapter 2: What can you do to increase the satisfaction rate?
Wouldn’t increasing their pay be enough? That seems to be the current thinking of a lot of companies and recruiters anyway; every job posting I have come across, every LinkedIn InMail I have received made sure to put “competitive pay” front and center. Let’s find out if that’s really the answer.
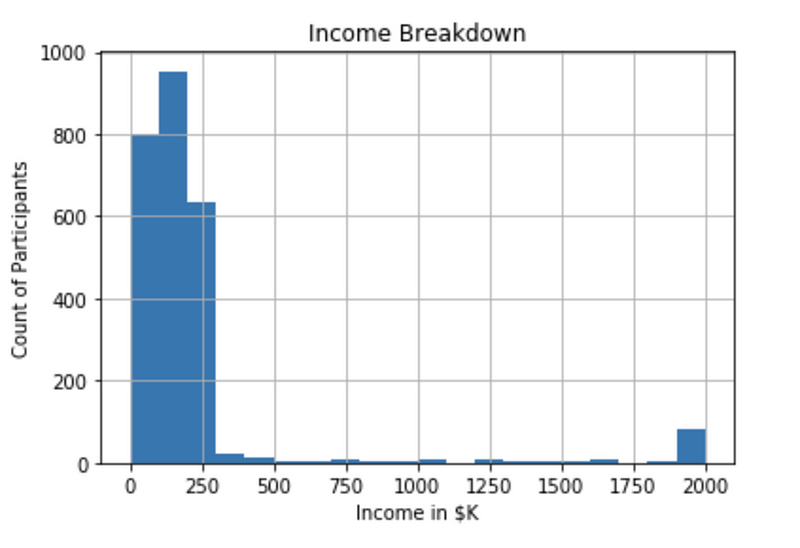
It’s important to remember that in order to properly assess the effect of pay on satisfaction, other possible confounding factors need to be controlled and outliers should be eliminated to make sure that they are not biasing the model. Looking at the income breakdown below, there are some extreme outliers. I have removed all the outliers that are more than 3 standard deviations away from the mean.
Since the analysis is using a limited dataset with participants only from the US and with data-related jobs, we are already controlling for country and roles. Other variables that are available in the survey that needs to be controlled for are company size, whether the respondents are hobby coders, years of coding experience, years of coding-related work experience, education level, and how often they work overtime. The logit regression (1: Very Satisfied, 0: everything else) shows us that the coefficient for total pay (in 10K unit) is an ignorable 1.012; this number can be interpreted as for every 10K increase in total compensation, the odds that the person will be “very satisfied with their job” increases by 1.2%, ceteris paribus. So sadly, money can buy you more Blue Bottle Coffee, but not happier employees.
So what else can we throw at the problem if money is not the answer? The survey creators also asked participants to “Imagine that you are deciding between two job offers with the same compensation, benefits, and location. Of the following factors, which 3 are MOST important to you?” (notice how the people who wrote this survey also assumed compensation is an important factor that would swing people’s opinion toward jobs).
This is the breakdown of the answers:
“Office environment” and “Language, frameworks and other technologies” are closely ranked at top of the list; both indicated by almost 15% of respondents as one of the top 3 job evaluation factors. Thinking back to my previous life as a Data Science consultant and how frustrated I was when I encountered clients who consider PDF as their “robust datasets storage” or even worse, have a toxic workplace culture, I’m not surprised by this at all.
“Flexible time” and “remote work options” follow closely after tech stack and culture. This is hardly surprising, especially in 2020/2021.
Opportunities for professional development also rank highly; companies that are not already doing it should seriously consider setting aside a budget for job-related learning opportunities.
If your company checks all the boxes above and it still didn’t stop your data talents from leaving you, don’t fret; next, we will take a look at how you can backfill the open positions faster.
Chapter 3: What can you do to attract new talents?
When asked “When job searching, how do you learn more about a company?”, almost 23% resort to third-party sites such as Glassdoor.
I can definitely vouch for this since that’s always the place I start my research about a company. Sites like Glassdoor do not only provide basic information about the size of a company or the open roles but also provide a glimpse into what it’s like to work there through anonymous reviews. This aligns with what we learned from above: people really care about companies’ culture.
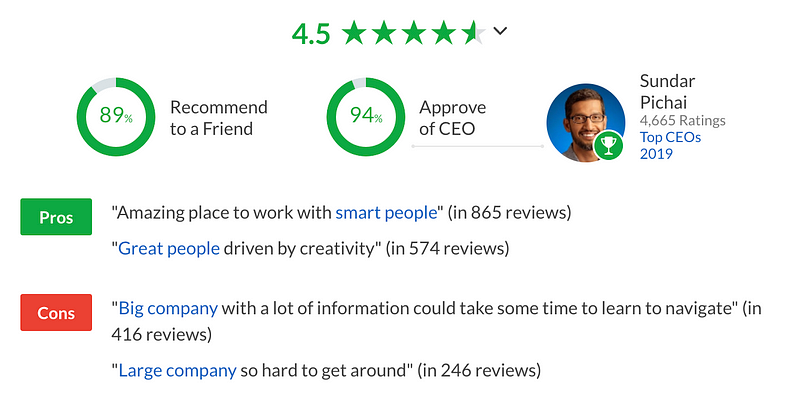
So companies’ abilities to attract new talents largely rely on how the current employees are treated and how happy they are; good thing we have already looked into exactly how to make that happen.
Conclusion: What is the takeaway?
Keeping the current data talents happy plays a big role not only in preventing churning of talents but also in attracting new ones going forward. In the next hiring post you put online, or the next recruiter phone call, instead of putting all the emphasis on “competitive salary”, maybe also consider mentioning the awesome tech stack and/or the great company culture you have been building.


